How to Analyze & Interpret Your Data to Improve Profits

We use data for everything – from setting budgets, to stocking and delivering orders, to marketing for target audiences. There are countless businesses that provide data organization and visualization services because it’s essential to make informed decisions, but few do so with enterprise value creation in mind. When fully understood and leveraged, good data drives multiples and improves profits year after year. However, there are numerous obstacles that could hinder your ability to leverage the data in your business.
In this post we’ll explore 4 actions you can take to improve profits through data you already have.
Access Your Data
There is a wealth of knowledge that lives inside the data that is already in your business. It’s not enough that it exists, you also need to ensure access to it. However, a few complexities arise when working to gain access to your data.
Multiple Data Systems and Sources
There are many reasons why your business may have multiple sources of data. First, you could have gone through mergers or acquisitions which resulted in disparate systems from legacy business practices. Second, business growth may require new systems or processes implemented in different departments that have not yet been integrated into a central system. Perhaps there are different data files and formats for various business units, divisions, or product lines. Last, you might outsource certain data inputs, such as competitive information or market indices that impact cost, which may require an additional process or system.
Pulling data from a variety of CRM, ERP, or other sources requires seamless, and if possible, automated data engineering in order to view the information as a unified, single database.
Manual Process
No matter how many data sources your business uses, those who work with data know it can be time consuming to make that data work for you. Whether you’re combining multiple Excel files, tracking down team members, manipulating formats and tables, or tying fields together, manual processes, especially those that aren’t repeatable, can become a black hole of time.
In some cases, companies may have never seen all their data – invoices, cost data, customer data, product/service masters – in the same place at the same time. Moreover, it’s imperative to make sure that at whatever frequency you conduct measurement or make business decisions, the ability to access data should be a repeatable, reliable process. Without access to data, your company may be making uninformed decisions that negatively impact your bottom-line profits. Without a repeatable process, you risk seeing data tell a different story every time without understanding why. Having an automated data engineering process enables you to spend your time analyzing and extracting valuable information from your data, instead of spending hours digging into files to identify issues.
Interpret Your Data Through Detailed Analysis
After aggregating your data and creating a more efficient, repeatable process, another key step in interpreting your data to help increase profitability is through dynamic analyses. A common challenge in employing data is ensuring you have the proper attributes and flags to compare and drill down on certain aspects of the information you want to gain insights from. It’s not enough to have standard charts such as volume growth, price realization, or even customer margin if they are static views. The secret to analyzing your data to generate more profitable decision making is the ability to slice and dice your data through a variety of cuts and robust interactions that pinpoint specific causes of events you may be experiencing. Easier said than done, this type of analysis often reveals information that can shock companies who have never seen their data like this before.
Let’s explore a few examples of analysis.
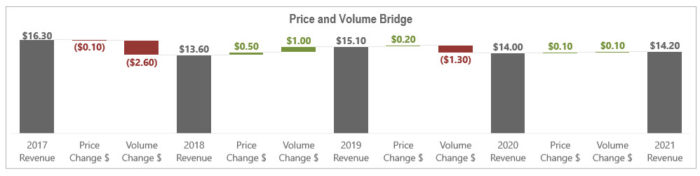
Price vs. Volume Mix
- If price went down anywhere, either on purpose or for unknown reasons, did you also sell enough volume to offset the lower price?
- Analysis can be viewed by revenue or margin, dollar or percent, and should include the ability to drill down by channel, product line, or other key attributes
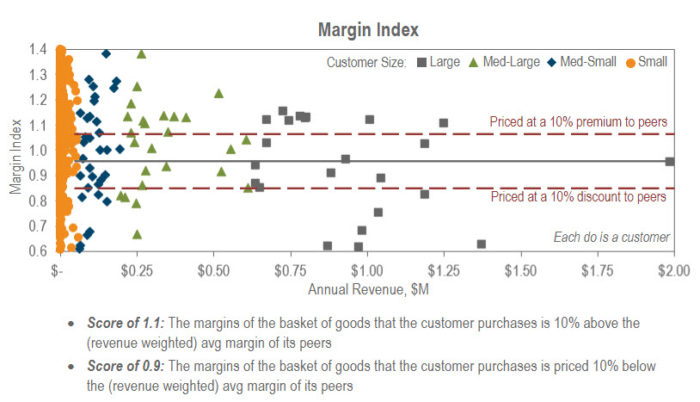
Mix-Adjusted Margin Index by Peer Group
- A margin peer group is a comparative group of attributes where margins are expected to be consistent; could include region, customer channel, qty. breaks, vendor, etc.
- Ability to drill into analysis to view a single customer or order is optimal; for example, margin variation across regions for 1 SKU
- This analysis can also be used to synthesize and understand the discounting occurring across regions, divisions, sales teams, or other groups based on where you’d expect margin to be consistent, indicating potential issues with sales compliance
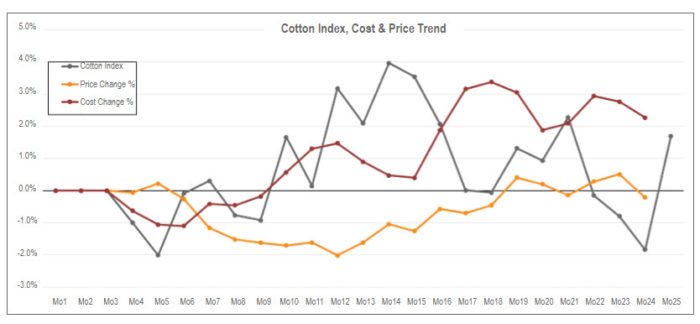
Price Change vs. Cost Change
- Is there a lag on costs between orders and invoices, affecting the ability to effectively pass-through true cost on orders
- Especially in a heavily commoditized business, cost change management is essential
The essential element to interpreting your data effectively is the ability to drill down to a single SKU, customer, or order and then examine it from different views. This practice will allow you to surface the cause of both desirable and undesirable patterns or one-time events more quickly and accurately.
Consuming your data through clear, interactive visualization tools or capabilities allows you to explore what is really happening in your business. Once you have a better understanding of your current state, you can use that information to change future business practices for improved profit.
Utilize Data to Affect Business Growth
A newfound understanding of your data will lead to insights that dictate new direction or pricing actions that help improve your profitability. Additionally, you may begin to see how you were previously misinterpreting data.
One of the most common misinterpretations of data is solving for customer and product mix. For example, perhaps margin % is a key KPI for your business and the last several months have shown margin % growth. While this is positive, your win-loss rates have been going down as a result of higher prices. Looking only at margin % increases may indicate business growth, while in reality the loss of volume, whether in certain regions or product lines or across the board, could actually indicate an overall loss in profits. This is one example of why it’s important to understand your key drivers for business growth and all the tangential areas that affect and indicate changes in your key KPIs.
Let’s look at a few examples to illustrate how a company’s internal beliefs were not in line with what was happening in their business, according to the data.
Company #1 believed their value to the customer was wide product breadth and they went to market with this value proposition. However, upon analysis, we found that most of their customers were not purchasing multiple different products from them. The opportunity: conduct a SKU rationalization exercise to identify, eliminate, or combine SKUs that aren’t valuable to the customers and may also be lowering profitability.
Company #2 had a razor and razor blade business model. They priced the initial product lower to attract new customers, expecting to do follow-on service on that product with a higher margin. However, we found that there were significantly fewer customers coming back for service than expected, lowering the overall business margin. The opportunity: conduct a differentiated price increase on the “razor” product with low margin customers to increase overall profitability.
Company #3 was hesitant to raise price for fear of losing volume. When we dug into the data, it showed that historical price increases were not accompanied by a drop in volume. Additionally, historical price decreases did not consistently result in volume increases. The opportunity: conduct a risk-adjusted differentiated price adjustment and consistently measure price or margin vs. volume mix. Then, arm your sales team with the proper training, tools, and processes to support pricing activities.
Company #4 sold highly engineered products through a good/better/best structure. The engineering team believed the highly technical product was the “best” and attributed pricing as such. After conducting a double-blind survey, they found this product was only “good” and that customers didn’t view this product the same way engineering did. The opportunity: conduct a market value and price equivalency exercise to understand the market perception and potentially shift what is considered good vs. better vs. best.
Implement an Ongoing Structure that Supports Data-Driven Decisions
To sustain results and improve profits for the long term, it’s vital to integrate a data-driven culture into your business.
- Build an automated data engineering process
- Identify the key KPIs that matter most to your business, and the supporting analyses that indicate growth
- Implement a data visualization tool or standard views that are easily absorbed and leveraged to identify patterns of success or future pricing opportunities
- Stand up regular review cadences with all levels of the organization to ensure visibility, accountability, and clarity on pricing actions and priorities from the sales team to the C-Suite
Data exists in all areas of your business; the key is knowing how to utilize it to your advantage. Successfully gaining access to it, interpreting it, and implementing the learnings across your business will take the guesswork out of pricing actions and provide direction to help you realize growth and improve profits. If you aren’t sure where to start, INSIGHT2PROFIT can help you understand your data and identify quantifiable opportunities for growth within just a couple of weeks.