Market Basket Analysis: How to Drive Sales, Improve Customer Retention, and Increase ROI

Businesses put considerable time and effort into data creation and collection, yet many leave money on the table by not leveraging said data to its full potential. Market basket analysis is one type of data analysis that is often underleveraged in the market yet can be a key driver of revenue growth and customer lifetime value.
Market basket analysis mines historical patterns in customer behavior to better inform your business in how to best nurture the health and wealth of your customers. This type of analysis began in retail industries, assisting retailers in understanding their customers’ behaviors by repeatedly analyzing the items they purchase. Today, this technique is a powerful set of calculations used across many industries to help businesses achieve their strategic growth initiatives.
In this article, we detail how your business can build a competitive edge through utilizing current data to its fullest potential.
What is Market Basket Analysis?
In its most basic form, this algorithm can be thought of as the heart of the “Recommended for you” section that greets you in big name B2C e-commerce websites. It analyzes your previous activity on their platform and uses that data to suggest additional products that you may be interested in purchasing. Incorporating this capability into an e-commerce platform where building customer relationships is incredibly difficult is an easy decision to make. It’s not feasible to have sales representatives responsible for thousands of customers and thousands of products, but having an algorithm that can create relevant, customized product recommendations which drive customer engagement almost seems like a table stakes capability.
However, B2C e-commerce examples are the tip of the iceberg when it comes to building out these capabilities. Market basket analysis is a crucial piece of the analytical puzzle that is used across many industries to drive various strategic growth initiatives, such as:
- Wallet Share: Drive revenue through increasing customer penetration on products already in their basket of goods
- Cross-Selling: Increase customer lifetime value through selling additional products to current customers
- Bundling: Craft product offerings to best reflect the value you bring to your customer base
- Loyalty Programs: Reward and grow recurring customer base through targeted customer interactions and incentives
- Promotions: Boost engagement and customer base through informing ideal target campaigns for opportunistic products
- SKU Rationalization: Actively manage product portfolio to maximize both top and bottom-line performance
- Inventory Management: Move excess and obsolete inventory to the customers who are most likely to need it, and price in demand inventory to reflect the value you bring to the market
- Sales Enablement: Provide the sales team with actionable guidance on who to target, what to sell, when, and why
These growth drivers are not unique to one industry, and though specifics of solutions will differ across businesses, the value added through a customized data-oriented approach towards customer management does not.
Market Basket Analysis Example
To gain insights into customers’ behavior patterns and preferences, you must look at what customers do or do not purchase together, how often they make those combinations over time, and the timing of those purchases. This information should also be cross-referenced with customer-specific attributes, such as location, size, or purchasing channel, to draw conclusions based on similar sets of customers. To walk through an example in more detail, let’s review a case study on running this analysis to determine optimal cross-selling opportunities within a business.
First, historic customer purchasing patterns are mined, and products that are purchased frequently together are identified. The frequency of which they are purchased together is considered in determining how much weight to give to a cross-sell product recommendation. Continuing this analysis over thousands of customers and products forms a network that links highly correlated products.
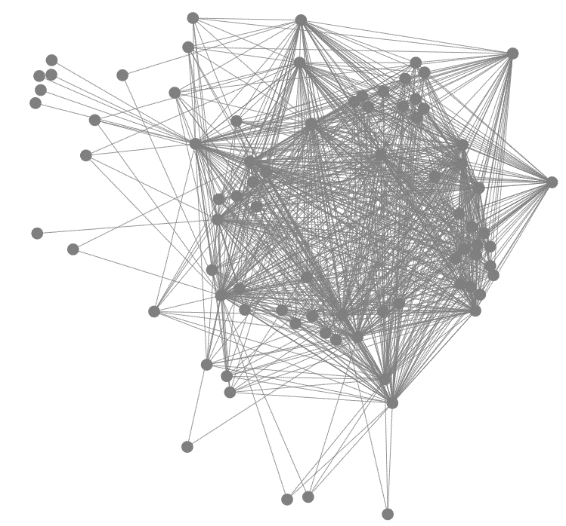
The visual above shows product correlations in a business’s product portfolio, with each node (circle) being a product, and each line connecting said product to other products which are frequently purchased together. These relationships are transposed onto every customer in the business. In this way, the customer’s full basket of goods is factored into finding optimal products that the customer is most likely to purchase based on their current activity.
Once purchasing patterns are understood, the next step is to calculate the target opportunity spend, or the potential spend to be gained through selling a customer an additional product. This is found by benchmarking the target customers opportunity spend to existing customer product spend across the business. In simpler terms, if most customers purchase $1 of Product A for every $2 of Product B, then a customer who purchases $4 of Product B would be expected to purchase $2 of Product A. Using this metric in combination with the likelihood of the customer purchasing the cross-sell product, you can prioritize product recommendations so that your sales team spends its time on opportunities with the highest likelihood of conversion and ROI.
Using the methodology above, a business can incorporate a full customer’s basket of goods into determining cross-sell opportunities, and then prioritize those opportunities by dollar size to best set their sales team up for success.
The Benefits of the Market Basket Analysis
One of the primary purposes of this technique is sales enablement, or giving a sales force the tools and information they need to efficiently manage and grow your customer base. Market Basket Analysis provides your sales team with actionable product recommendations that allow your business to increase both customer-spend penetration and breadth of customer basket of goods. These factors combined lead to entrenched customer relationships, sales force efficiency, and position your business for growth.
We have reviewed how implementing this strategy into an e-commerce platform is a straightforward decision, but it is worth specifying how this can add value across other types of businesses. In any organization that has hundreds to thousands of customers and products to manage, it is necessary to leverage data to encapsulate the full picture of customer behavior. Providing insights derived at this scale to the front line of a sales organization ensures representatives are set up for success in growing their customers’ portfolio.
Any business that relies on in-person customer relationships and experiences employee turnover in their sales force understands the learning curve that new sales representatives need to climb. Between understanding the business’s product offering and forming customer relationships, there is little time to focus on company growth drivers we have referenced before. To expedite the learning curve process as well as optimize the time of tenured representatives, it is imperative to provide easy access to the metrics they need to know about their customers. This includes information on:
- Customer historic purchases with the business
- Cross-selling and wallet share opportunity products
- Automatic flags that alert the sales rep when a customer misses a recurring order
- Relevant quantity break information that can be used to drive additional volume across the customer’s basket of goods
As mentioned earlier, this data analysis can also enable you to accelerate strategic growth initiatives, such as:
- Wallet Share
- Cross-Selling & Bundling
- SKU Rationalization & Inventory Management
Wallet Share
Share of wallet examines how much a customer spends with you versus your competitors. Increasing a customer’s wallet share tends to coincide with increased customer loyalty and retention as customers grow to understand they can rely on you for quality products that they care most about. Understanding where you have opportunity to grow your wallet share ensures your sales force is spending their time in areas with the highest likelihood of driving customer growth and retention.
The Harvard Business Review shared research by Frederick Reichheld of Bain & Company that found a 5% increase in retaining customers can lead to a 25% to 95% increase in profits. It costs more to acquire a new customer than it does to retain an existing one, and returning customers are more loyal and can even act as a referral source. Market basket analysis provides customer-product-specific spend targets based on comparable customer purchasing patterns, directly enabling sales teams with talking points to expand wallet share.
Cross-Selling and Bundling
Cross-selling analysis identifies target products or services that a customer is most likely to add to their current basket of goods. Implementing and realizing the benefit of this analysis differs across industries but can incorporate curated and prioritized lists of customer cross-sell targets and an outreach plan for sales to execute.
Data from market basket analysis can also help strategize complex product bundling approaches. In SaaS businesses, this leads to optimal product bundles – based on customer and market research – to sell as a distinct package that resonates with the market and drives revenue and profitability.
SKU Rationalization and Inventory Management
Market basket analysis can also help drive a SKU rationalization strategy. SKU rationalization typically segments products into 4 quadrants:
- High Profitability, Low Sales
- High Profitability, High Sales
- Low Profitability, Low Sales
- Low Profitability, High Sales
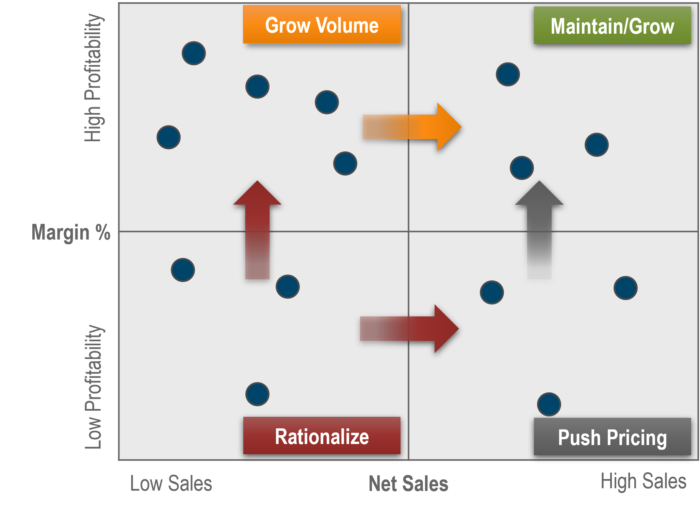
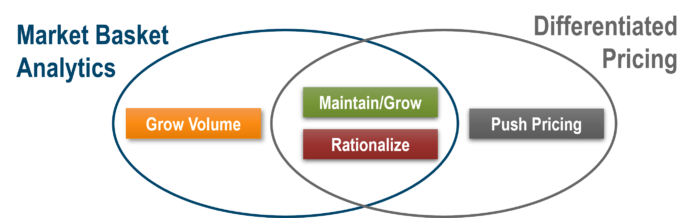
This perspective informs corrective action for those SKUs that aren’t performing as desired. For example, a low sales and low profitability SKU may be best to discontinue, while a high sales and low profitability SKU would benefit from a differentiated price adjustment. High profitability SKUs have an opportunity to be promoted or suggested by sales reps, especially to those customers which market basket analysis has identified as being the most likely to purchase. In this way, SKU rationalization can utilize both market basket analytics to drive volume, and a differentiated pricing strategy to grow profitability.
SKU rationalization and market basket analysis also help better manage inventory levels. An overabundance of stock that is taking up inventory is a liability if sales representatives cannot find customers to purchase the product. However, with the ability to find which customers are the best fit for purchasing specific products, sales reps can more efficiently move obsolete or time sensitive products out of the warehouse. Also, unexpected changes in demand or stock can be mitigated with shifts in sales promotions via customers most likely to purchase said inventory.
Implement Strategic Growth Drivers with INSIGHT2PROFIT
When businesses partner with profit consultants like INSIGHT, they gain a deeper understanding of their overall customer landscape, profitability, and opportunities for growth. Market basket analysis is just one area of expertise that INSIGHT uses to tailor its solutions to your specific customers, industry, and business goals.
Our pricing experts understand that driving profitability and growth isn’t a one-size-fits-all method. Contact us if you need a customized, data-driven approach to price management and increasing profits.